

 |
 |
 |
 |
 |
 |
 |
 |
 |
 |
 |
 |
 |
 |
 |
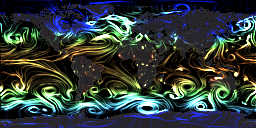
The brightness and direction of the contours represents surface wind speed and direction. The color is based on the surface (2m) temperature, and varies from dark blue below freezing, up to green at around 10-15°C/50°F, yellow around 25-30°C/80°F and red at about 40°C/105°F.
This is a hobby project by artist and game developer Dave Frampton - @majicDave. I've written an application which takes freely available GFS and WAVEWATCH III weather model data, and produces nice looking images. I will try to keep these images up to date, but make no guarantees on the reliability or accuracy.
Times and dates are displayed for your local timezone.
